2 Random JS packages I Found Helpful for Creating the myBPI App!

Before my job search even officially began, I received a referral to a ML company that needed a front end engineer. It was a very long process and it included a take home assignment, I needed to make a frontend app that handles big data. Eventually I turned the assignment into a small project I could use to hone and show off my skills. Today I’m going to show you guys 2 JS packages that I found pretty useful while working on my take home! They are “he” and “react-line-graph”!
he
“he” (stands for HTML entities) is an npm that encodes/decodes HTML entities such as ampersands and other symbols to be displayed in JavaScript. I used “he” to be able to display “£” or “€” currency symbols in the “myBPI” app I created. Here is how I used “he” in my code base…

I iterated through the received data and decoded the symbol in the data to display it to the user on the DOM. All you need to do to use “he” is to follow these steps…
Installation
In your console, navigate to the working directory and type in…
npm i heThis will add “he” to your package.json file. Now to use “he” in your js files you just need to import it like so at the top of the file…
import he form 'he';and you’re all set to go! If you want to learn more about “he” you can click this link to view the official documentation.

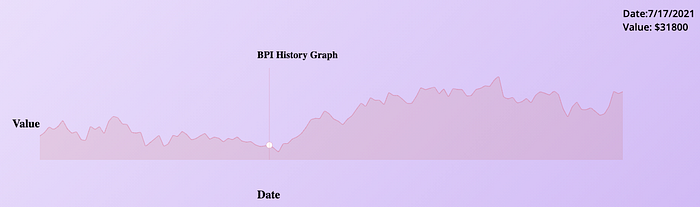
react-line-graph
I’ve explained react-line-graph in another post so I’ll make this quick. We can use react-line-graph (RLG for short) to create quick and easy graphs that are react component compatible. Now I would highly recommend checking out D3JS, especially if you have the time. D3JS gives you way more control of displaying visual data and is a sought out skill for many employers!

Here is my use of it in the “LineGraphData.js” file. Lines 23–32 explain the graph structure, meanwhile line 36 calls the graph component with the specs variable passed in as a prop. This is way easier and quicker than learning D3JS and still allows you to make great graphs. Similarly installation is as follows…
Installation
In your console, navigate to the working directory and type in…
npm i react-line-graphThis will add RLG to your package.json file and to use it in a js file you are going to import like so…
import LineGraph from 'react-line-graph';Then you will be able to use it like I did! If you want to learn more about how to use it, I would highly recommend you visit this link for documentation and view the project repo to look at files: “LineGraphData.js and PointValue.js (to see how the hover works)”.
Another short one but I hope this helped you guys! And as always… Happy Coding! :D